Places To Go
Floridians and those who visit enjoy a few common luxuries: no matter which Florida city or region you're in, you're always within a few hours from the ocean, the winters are generally warm and fresh, and locally caught seafood and homegrown citrus is plentiful.
But that doesn't mean all Florida cities are alike. Each has its own unique history, identity and story to tell, whether it's a large urban metropolis or a small community built around its strawberry crops or cattle ranches.
Whether you're looking for big-city excitement and entertainment or small-town quiet and curiosities, the best places to visit in Florida are the ones tailored to your taste.
While Jacksonville is the most populated city in the Sunshine State, tourists often overlook its strengths as a vacation spot next to theme park-heavy Orlando or the beach-blessed coastal cities. But Jacksonville's parks, museums and historic sites are marvelously laid our and the Jacksonville Zoo and Gardens is an amazing attraction for visitors young and old.
There's also Tampa, enjoying a revitalized downtown that includes some of the city's best restaurants, urban parks, bars and a Riverwalk that attracts joggers, bikers and couples out on a stroll. Fort Lauderdale is one of the best places to visit in Florida for those wanting a winning combination of beaches, shopping and dining.
For visitors looking for a more quiet place to visit in Florida that still offers plenty of activities, cities such as Cape Coral, Gainesville, Fort Myers and Pensacola offer the perfect getaway plans. All offer top-notch golf courses, cozy bed and breakfast inns and fabulous restaurants without the traffic of the big Florida cities. Palm Bay, the biggest city in the Space Coast area, has some of the state's best nature trails at the Turkey Creek Sanctuary but also has beaches and other attractions for both kids and adults.
Some prefer more off-the-beaten-path towns such as Dunedin with its tiny but charming downtown and nearby parks, the historic St. Augustine filled with old stone fortresses and museums or quaint Mount Dora and its fun shops and restaurants.
Tiny Weeki Wachee built its livelihood on its 70-year-old underwater mermaid show and its natural springs, and Arcadia is known for some of the best antiquing around, all concentrated within a few blocks.
Each Florida city has its own collection of places to visit and gems to offer, whether its secluded beaches, Spring Training baseball, roadside oddity attractions or award-winning golf courses. Pinpoint your favorites to create the perfect escape.
Planning a trip to the Sunshine State but can’t decide between beaches or theme parks?
Torn between surfing on the Atlantic Coast and fishing on the Gulf Coast? Wondering what there is to do near your secluded, romantic bed and breakfast? Checking out VISIT FLORIDA’S interactive map of Florida before you travel is a helpful starting point.
Whether you’re going on a weekend getaway, a spring break jaunt or a summer road trip, you’ll never run out of things to do in Florida, a state packed with nature trails, parks, boating docks, roller coaster rides, museums and more.
Many visitors have a starting point in mind – say, Daytona Beach or St. Augustine – but then get curious about what there is to explore nearby, which is where our Florida map comes in handy. Others have a general activity they like to do while traveling, such as camping or trying unique restaurants, and want to know exactly where the best Florida destinations are before booking a ticket or hitting the road. And speaking of roads, a trip from the top of the peninsula to the southernmost point is doable in a day or two. But why rush when you can take time to discover some of Florida’s hidden gems, weird roadside attractions, quirky beach towns, outdoor art festivals and wildlife rescue sanctuaries?
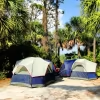
Check out some of the small-town, family-friendly events going on within an hour or two’s drive from Jacksonville, Orlando or Miami using our map of Florida. Or hit some of the best campsites in north Florida, coolest natural springs in central Florida or most popular outlet malls among true bargain hunters in South Florida.
Browse the Florida map and take a detour off of Interstate 4 to check out some odd museums and parks, or break off from I-75 to do some nature hiking or wine tasting. Relax on a front-porch rocking chair and try fresh citrus juices at the Grove House in Lake Wales or make a day trip out of a stopover in beautiful Naples or the laid back New Smyrna Beach.
If you’re anywhere near the Everglades, swing over to Billie Swamp Safari on the Big Cypress Seminole Indian Reservation, where you can learn the history of the Seminole Tribe or sample frog legs or alligator tail at the Swamp Water Café. It’s easy to hunt down some of the lesser known but most memorable Florida destinations by doing a little bit of map-scanning before you travel. Even the best laid plans should leave room for spontaneous adventure.